THE DEAL MATRIX · NOV 5, 2026 · AGGREGATE
2,909 FOR SALE · 5,816 LEASE SPACES
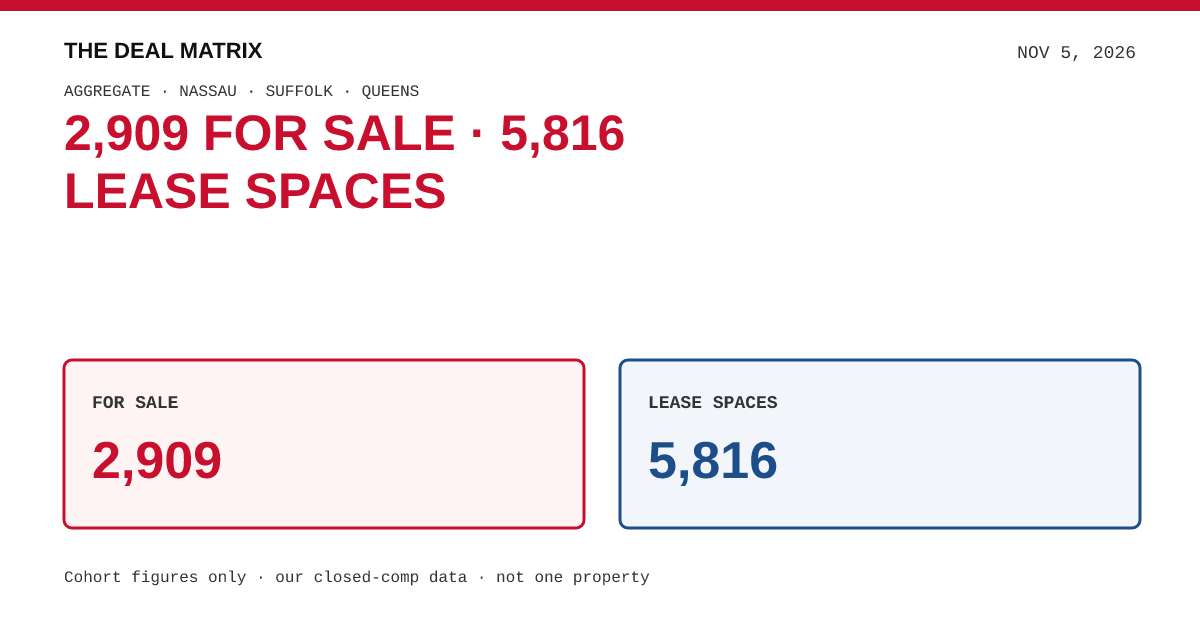
Our active listing database, snapshot November 5, 2026, holds four separate books across Nassau, Suffolk, and Queens: 2,909 properties for sale, 5,816 lease spaces, 648 commercial land listings, and 380 businesses for sale. A business can also appear in the sale book, and a lease row is a space or space-use record, so these books are not a count of unique properties. Our closed-comp data separately shows 30,427 eligible dated sales in these counties, drawn from 63,832 stored records that cover every geography and can repeat an observation. The comparison window runs from October 27, 2026 to November 5, 2026, nine days. A listing missing from this pull is not a confirmed off-market event, and a newly captured record is not necessarily a new listing.
- FOR SALE
- 2,909
- LEASE SPACES
- 5,816
- LAND
- 648
- BUSINESSES
- 380
Snapshot November 5, 2026, compared with October 27, 2026: nine days, not a seven-day week. Every published cohort has at least 5 records. A missing figure is withheld, not zero. The four inventory books can overlap. Lease rows are spaces, and a business can also sit in the sale book. They are not a unique-property total. Asking-versus-closed spreads compare unadjusted cohorts. They are not matched-property discounts or appraisals. Low and high bounds on Market Insights are the P25–P75 interquartile range, not the lowest and highest listing. A record absent from this pull is not a confirmed off-market event. Newly captured coverage is not necessarily a new listing. Closed-sale counts separate 63,832 stored records across all geographies from 30,427 eligible dated sales in Nassau, Suffolk, and Queens. Outside headlines are market context from other publications. They are not observations in our transaction database, and this site does not republish article text.